Processing Aggregate Queries in a
Federation of SPARQL Endpoints

Abstract

More and more RDF data is exposed on the Web via SPARQL endpoints. With the recent SPARQL 1.1 standard, these datasets can be queried in novel and more powerful ways, e.g., complex analysis tasks involving grouping and aggregation, and even data from multiple SPARQL endpoints, can now be formulated in a single query. This enables Business Intelligence applications that access data from federated web sources and can combine it with local data. However, as both aggregate and federated queries have become available only recently, state-of-the-art systems lack sophisticated optimization techniques that facilitate efficient execution of such queries over large datasets. To overcome these shortcomings, we propose a set of query processing strategies and the associated Cost-based Optimizer for Distributed Aggregate queries (CoDA) for executing aggregate SPARQL queries over federations of SPARQL endpoints. Our comprehensive experiments show that CoDA significantly improves performance over current state-of-the-art systems.

Authors: Dilshod Ibragimov, Katja Hose, Torben Bach Pedersen, and Esteban Zimanyi

Queries

SSB defines 13 queries. They represent 4 "prototypical" queries with different selectivity factors. A brief description of the queries is given in a table below. We converted all 13 queries defined into SPARQL and used the SERVICE keyword to query endpoints for all triple patterns.

Query Prototypes Query No Query Parameters for Various Selectivities
Prototype 1. Amount of revenue increase that would have resulted from eliminating certain company-wide discounts. Q1.1 Discounts 1, 2, and 3 for quantities less than 25 shipped in 1993
Q1.2 Discounts 1, 2, and 3 for quantities less than 25 shipped in 01/1993
Q1.3 Discounts 5, 6, and 7 for quantities less than 35 shipped in week 6 of 1993
Prototype 2. Revenue for some product classes, for suppliers in a certain region, grouped by more restrictive product classes and all years. Q2.1 Revenue for 'MFGR#12' category, for suppliers in America
Q2.2 Revenue for brands 'MFGR#2221' to 'MFGR#2228', for suppliers in Asia
Q2.3 Revenue for brand 'MFGR#2239' for suppliers in Europe
Prototype 3. Revenue for some product classes, for suppliers in a certain region, grouped by more restrictive product classes and all years. Q3.1 For Asian suppliers and customers in 1992-1997
Q3.2 For US suppliers and customers in 1992-1997
Q3.3 For specific UK cities suppliers and customers in 1992-1997
Q3.4 For specific UK cities suppliers and customers in 12/1997
Prototype 4. Aggregate profit, measured by subtracting revenue from supply cost. Q4.1 For American suppliers and customers for manufacturers 'MFGR#1' or 'MFGR#2' in 1992
Q4.2 For American suppliers and customers for manufacturers 'MFGR#1' or 'MFGR#2' in 1997-1998
Q4.3 For American customers and US suppliers for category 'MFGR#14' in 1997-1998

Datasets

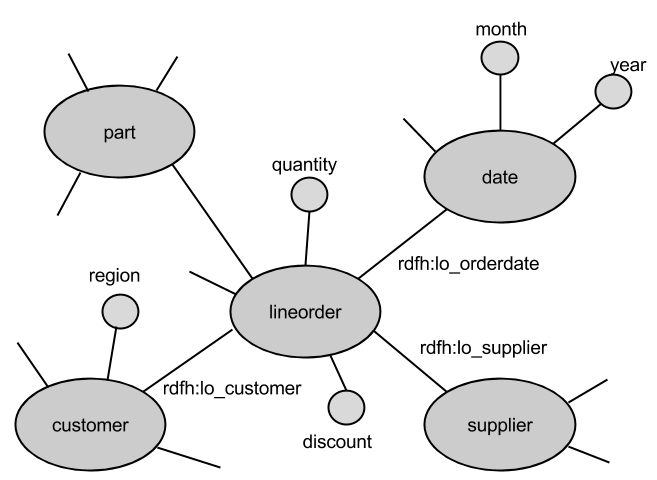
The data in SSB is generated as relational data. We used different scale factors (1 to 5 - 6M to 30M observations) to generated multiple datasets of different sizes. We translated the datasets into RDF using a vocabulary that strongly resembles the SSB tabular structure. For example, a lineorder tuple is represented as a starshaped set of triples where the subject (URI) is linked via a property (e.g., rdfh:lo_orderdate) to a an object (e.g., rdfh:lo_orderdate_19931201) which in turn can be subject of another star-shaped graph. Values such as quantity and discount are connected to lineorder entities as literals. A simplified schema of the RDF structure is illustrated in the figure below. Converted datasets contain 110,5M (scale factor 1) to 547,5M (scale factor 5) triples

SSB RDF Schema

Copyright © 2014 - All Rights Reserved - EXTBI